
About Me
Hi! I'm Jonathan, an undergraduate Data Science and Economics double major at Clark University, based in Queens New York.My interests include data/business analytics, machine learning and geographic information systems, using data-driven insights to solve real-world challenges in urban economic development and community advocacy. I also leverage these skills in the world of sports analytics, as an avid enthusiast.Beyond academics, I compete as a member of Antigua and Barbuda’s National Chess Team, with appearances at the International Chess Olympiad (2020, 2021, 2024) and World Youth Rapid Championship. I also enjoy soccer, mixed martial arts, and swimming. On the creative side, I love photography and learning languages in my free time.
Skills

Excel | PostgreSQL | Tableau | Python | ArcGIS Pro
Data Visualization - 2+ years
Data Wrangling - 2+ years
Data Cleaning - 2+ years
Report Development - 2+ years
Database Management - 2+ years
Visual Storytelling - 2+ years
Machine Learning - 1+ years
Digital Mapping - 1+ years
Featured Projects
SQL | Tableau | Python
The Massachusetts Data Science Job Market: Nov - Dec 2024
A comprehensive analysis including insights into job postings, salaries, locations, and remote work opportunities.


Excel | Python
English Premier League: Gameweek Reactions and Final Table Forecast
Gameweek reaction analysis using Natural Language Processing and Random Forest model prediction of the 2024/25 Premier League Season
Excel | Python | Arcgis
Bridging the Gap: Exploring New York City’s Transit Deserts
Identifying and assessing transit deserts in New York City using GTFS and census data to analyze disparities in public transportation access for low-income and marginalized communities.

Excel | Python | Arcgis
Mapping the road to reparations: Exploring Grassroots African American History in Massachusetts
Using data to show the presence, movement, and stories of African Americans in Pioneer Valley and Massachusetts from the 1700s to the present.

The Massachusetts Data Science Job Market: Nov - Dec 2024
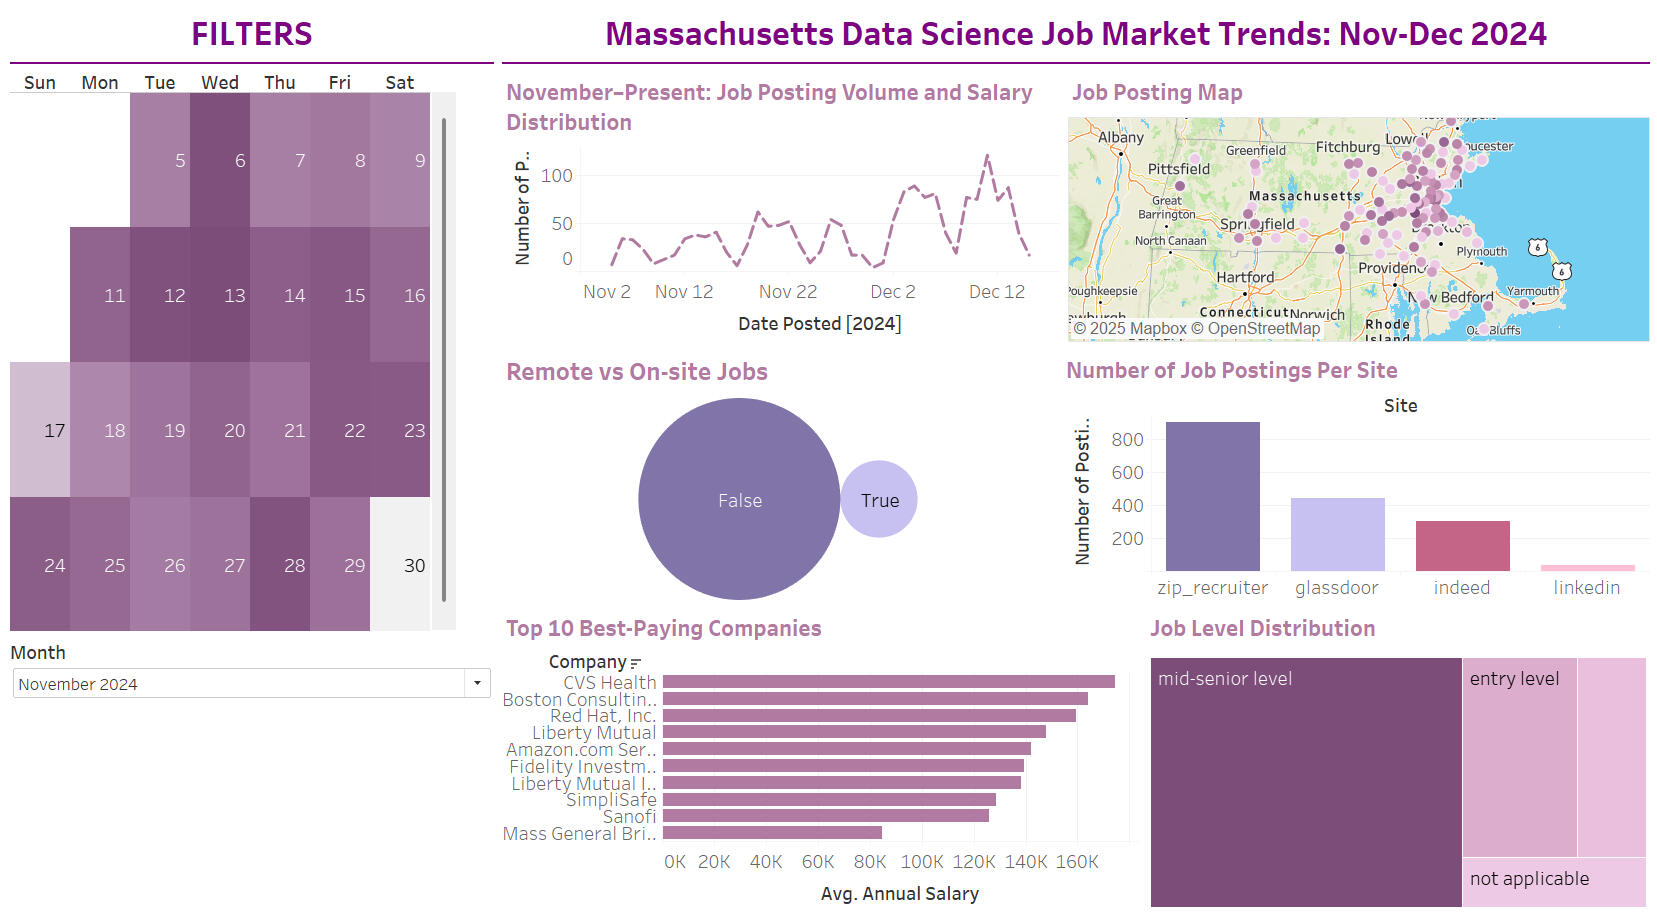
In December 2024, my colleagues Branson, Alexia, and I investigated trends in Massachusetts' data science job market, focusing on postings, salaries, and remote work.Here are the questions that we were interested in answering:
1) What are the key trends in the Data Science job market in Massachusetts?
2) What skills and traits do companies usually look for in applicants?
3) How are data science jobs distributed across different cities/regions in Massachusetts?
4) What salary range is typically offered for data science roles?
5) What proportion of data science roles are on-site compared to remote, and how does that affect salary?We took the following steps to conduct our analysis:
1) Scraping job posting data from Google, Indeed, LinkedIn, ZipRecruiter and Glassdoor using the JobSpy library.
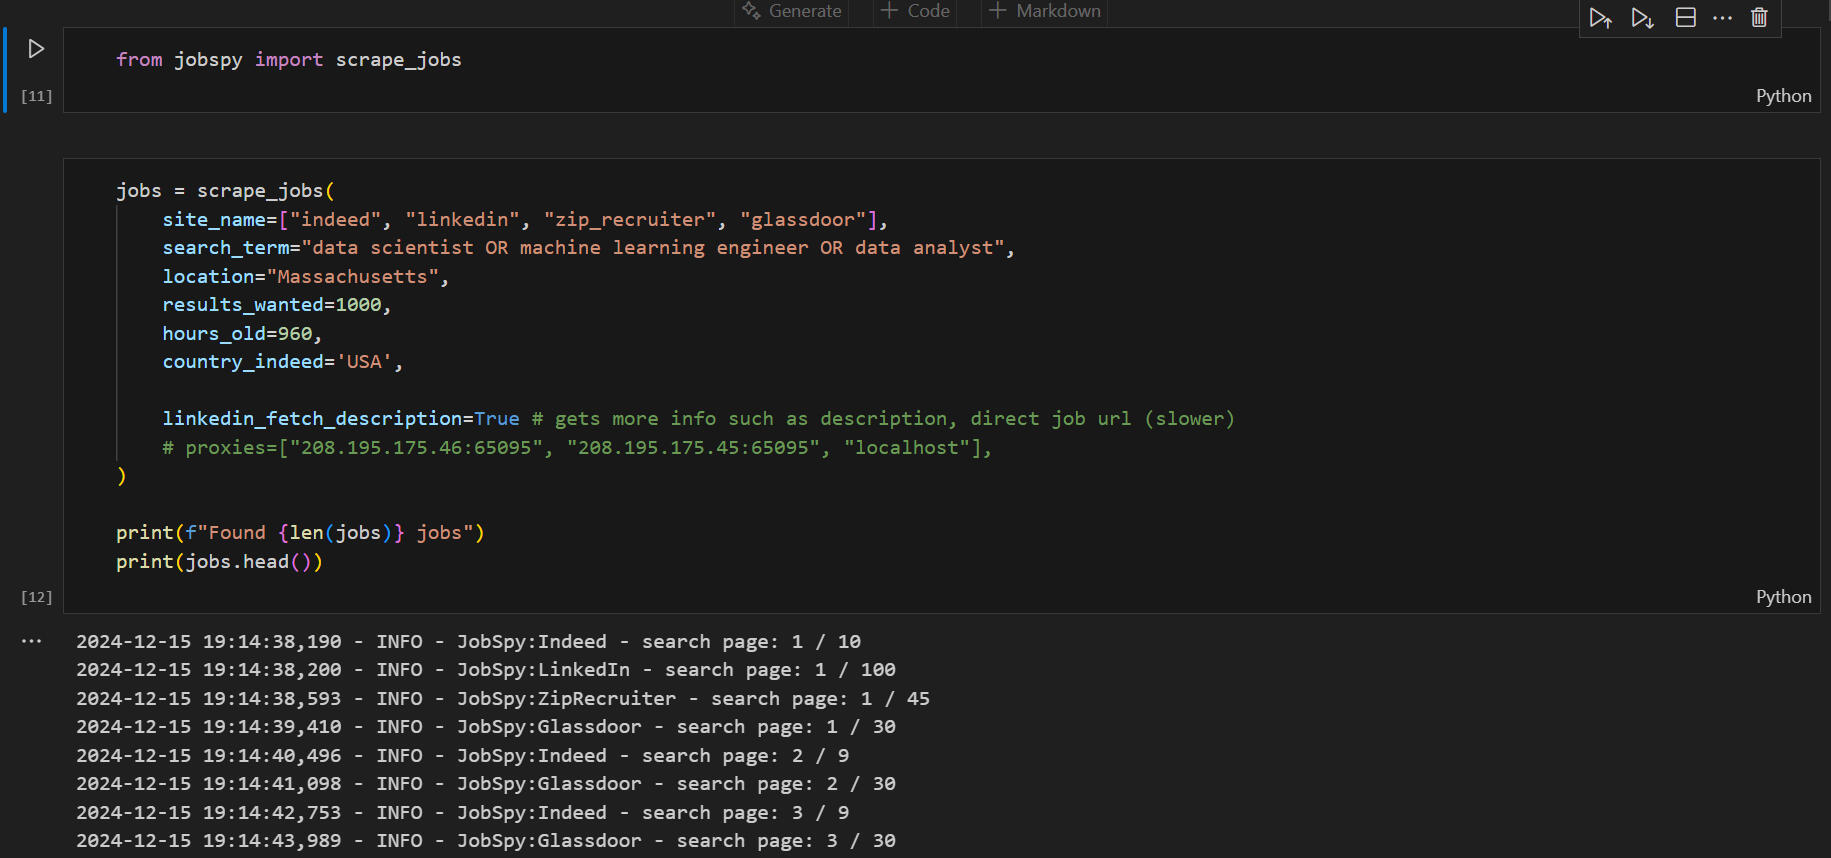
We narrowed down our scraping to the past one and a half months of job postings in order to prioritize active & relevant job openings while also avoiding ghost jobs.
2) Cleaning the data and preparing it for analysis.
3) Storing the data in a SQL database for efficient querying and long-term scalability.
4) Creating interactive charts, graphs, and geospatial maps using Python libraries (Matplotlib, GeoPandas) to analyze patterns, then refining and publishing visualizations in Tableau.
5) Creating and formatting an interactive dashboard and syncing worksheets for appropriate filtering.Here were our key takeaways:
1) We found that the majority of job postings were unsurprisingly located in or around the Boston Area, and tended to be on the end of higher-paying jobs as well.
2) We identified key words present in job descriptions (excluding common stopwords), which could prove useful in applicants looking to optimize their hiring chances. The most prominent term was "experience," appearing in over 4,000 postings.
3) Over the past month, the majority of positions were regular-level positions, with internships and other categories making up a small percentage in comparison.
4) The average annual salaries varied significantly by experience level: Interns earned $52,368, Regular (mid-level) positions averaged $130,360, and Senior roles commanded $153,749. Management positions consistently ranked among the highest-paying roles.
5) Amazon led all companies in listed job postings, followed closely by Mass General Brigham, Harvard University, and Fidelity Investments.

Explore our findings in the interactive Tableau dashboard below! (Also available on Tableau Public)

English Premier League: Gameweek Reactions and Final Table Forecast
In April 2025, I explored two sides of football fandom: analyzing how Reddit discussions shift during Gameweeks using NLP, and predicting the 2024/25 final table with a Random Forest model.Here were my project objectives:
1) Analyze commonly discussed topics during and outside EPL gameweeks using Natural Language Processing (NLP)
2) Predict the 2024/25 Premier League season standings using a Random Forest model trained on previous seasons
3) Optimize model performance by experimenting with feature selection and different training year combinationsScope (NLP):
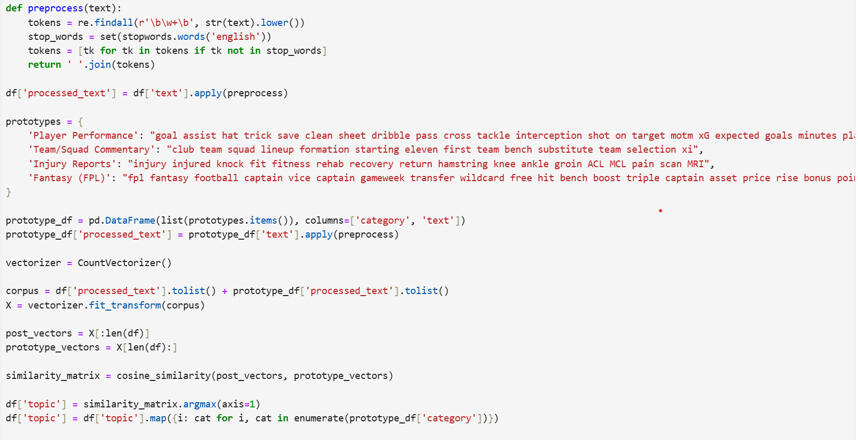
I applied NLP techniques to analyze just under 1000 Reddit posts related to Gameweek 30 and Gameweek 34 of the Premier League season and defined during-game & non-game periodsThe NLP analysis was done through the following steps:
1) Defined post/topic categories and during game/non-game
2) Vectorized both posts and categories
3) Used Cosine Similarity to measure how closely each post matched each category
4) Assigned each Reddit post to the category with the highest similarity score
Here were my key takeaways:
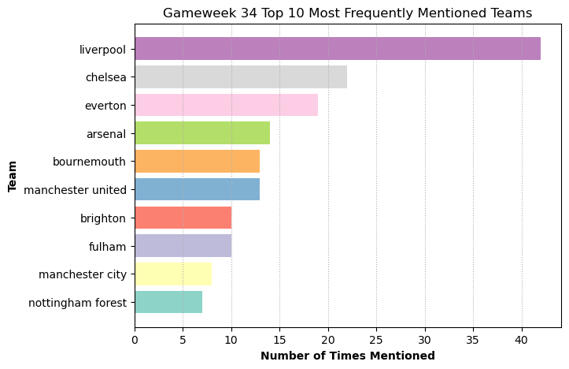
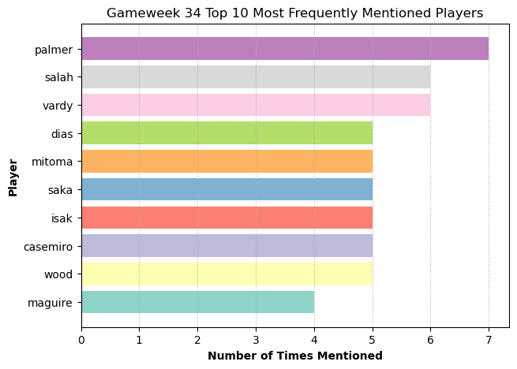
1) The results (as shown in the bar charts below) reflected fan hype surrounding the title winners, as in Gameweek 34 Liverpool clinched the Premier League title with their 5-1 thumping of Tottenham. Cole Palmer was the most frequently discussed player, likely somewhat due to his extremely poor run of form given his calibre.
2) All discussion categories (Player Performance, Team/Squad Commentary, and Injury Reports) showed noticeably higher post volume during game periods. The sole exception was Fantasy Premier League related posts, which saw a higher post volume during non-game periods (FPL manager seem to discuss strategy and other topics more often prior and after games, rather than during).

3) As for overall topic discussion (irrespective of gametime period), player performance accounted for 72% of discussions, followed by team/squad commentary with 19.6%, FPL with 6.1% and injury reports with 1.9%.

The Random Forest Model was run using the following steps:
1) Historical Premier League data (points, wins, draws, losses, goals for, goals against) was used, with simple calculations were done to make additional features using the prior statistics.
2) The model was initially run using a training set from the last ten seasons (2015/16 to the current season, up to the most recent gameweek), and was rerun until only the last 2 seasons (2023/24 & 2024/25) were used. The accuracy of each prediction was measured by calculating the Mean Absolute Error (MAE).

Here were the key takeaways:
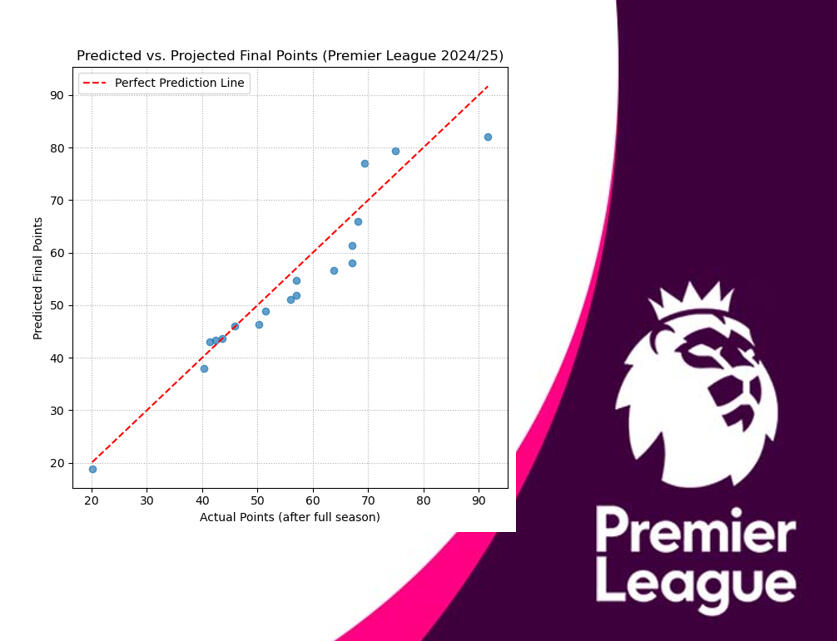
1) The year combination that yielded the most accurate prediction—based on the lowest Mean Absolute Error (MAE)—was the 2022/23 to 2024/25 seasons, with an MAE of just 3.95 points. Using this optimal model, scatter and regression plots were made to visualize the relationship between actual and predicted points & projected final points and predicted points.


2) While some table placements were predicted correctly (Brighton, Leicester, Southampton and Crystal Palace) and the overall structure of the predicted table was reasonably close, there were some notable exceptions, such as Manchester United and Nottingham Forest.
3) These deviations highlight the unpredictable nature of the Premier League, where factors such as managerial changes, ownership shifts, transfers, and injuries can significantly alter team performance over the course of a season.
4) Even accounting for these factors, a key limitation of this project was the absence of more advanced statistics such as expected goals (xG), which is used within the majority of football-related statistical analyses. Obtaining these (and other) advanced statistical metrics often require paid subscriptions, and were therefore not used.
Bridging the Gap: Exploring New York City’s Transit Deserts
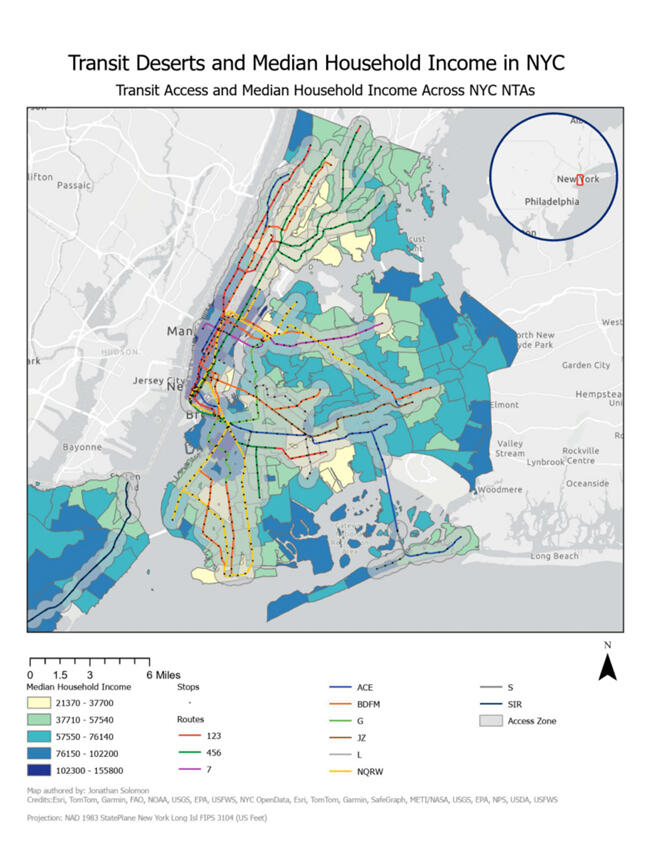
In March 2025, I explored the transit desert issue in New York City. Having moved to New York a few years ago, I worked jobs prior to coming to university where I would have to travel across the city, often in and around transportation deserts.
I sought to address the following objectives:
1) Identify and visualize transit deserts within NYC.
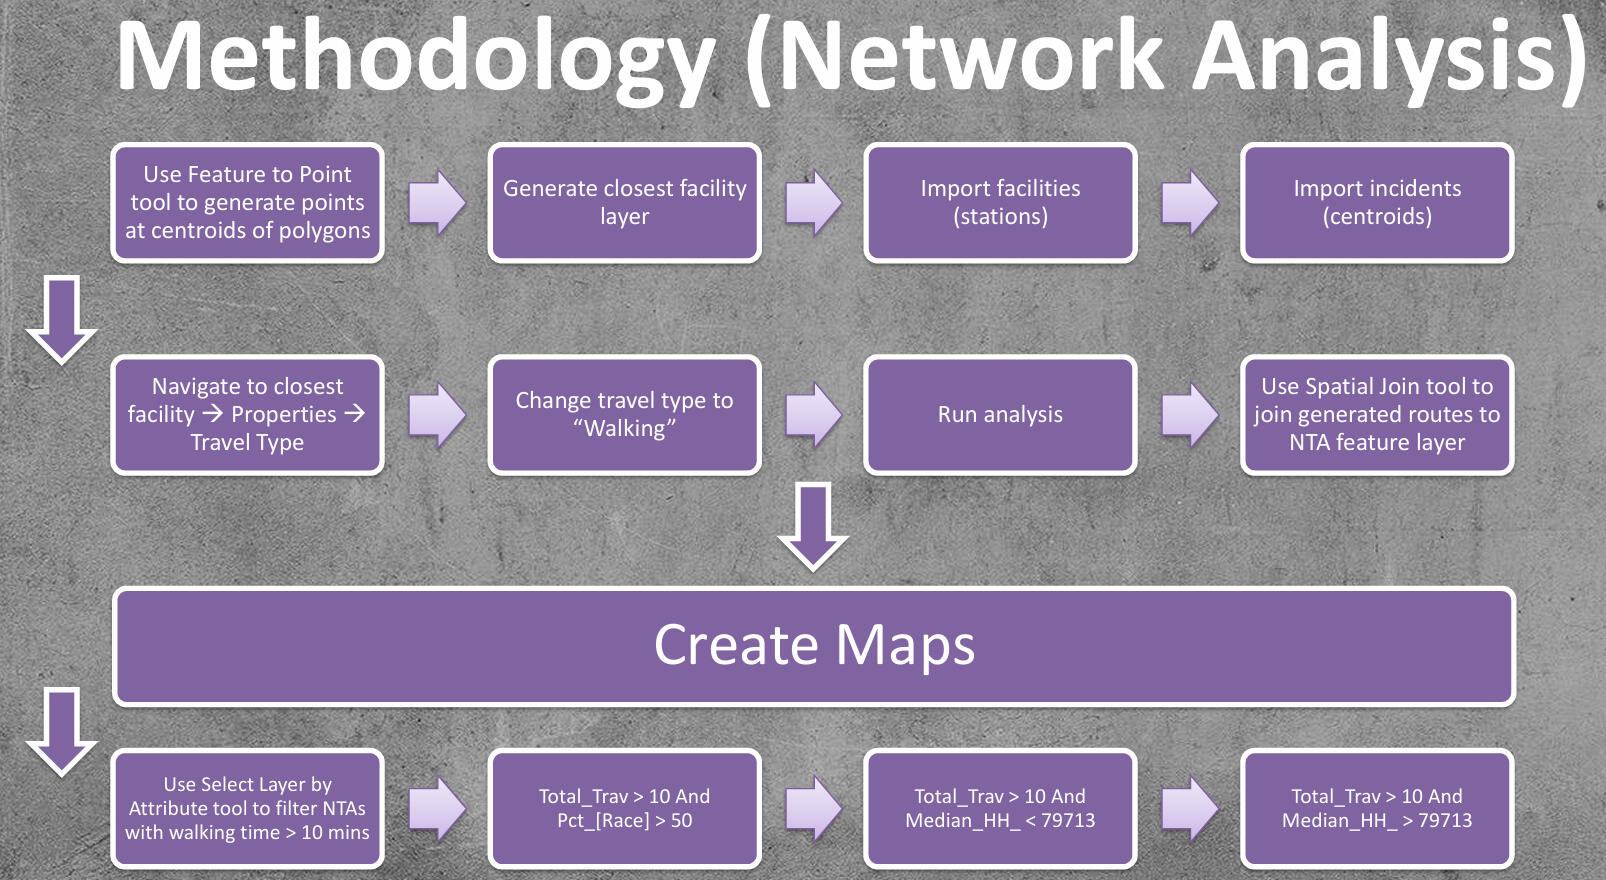
2) Determine whether marginalized groups are disproportionately affected by conducting a network
analysis (Closest Facility).
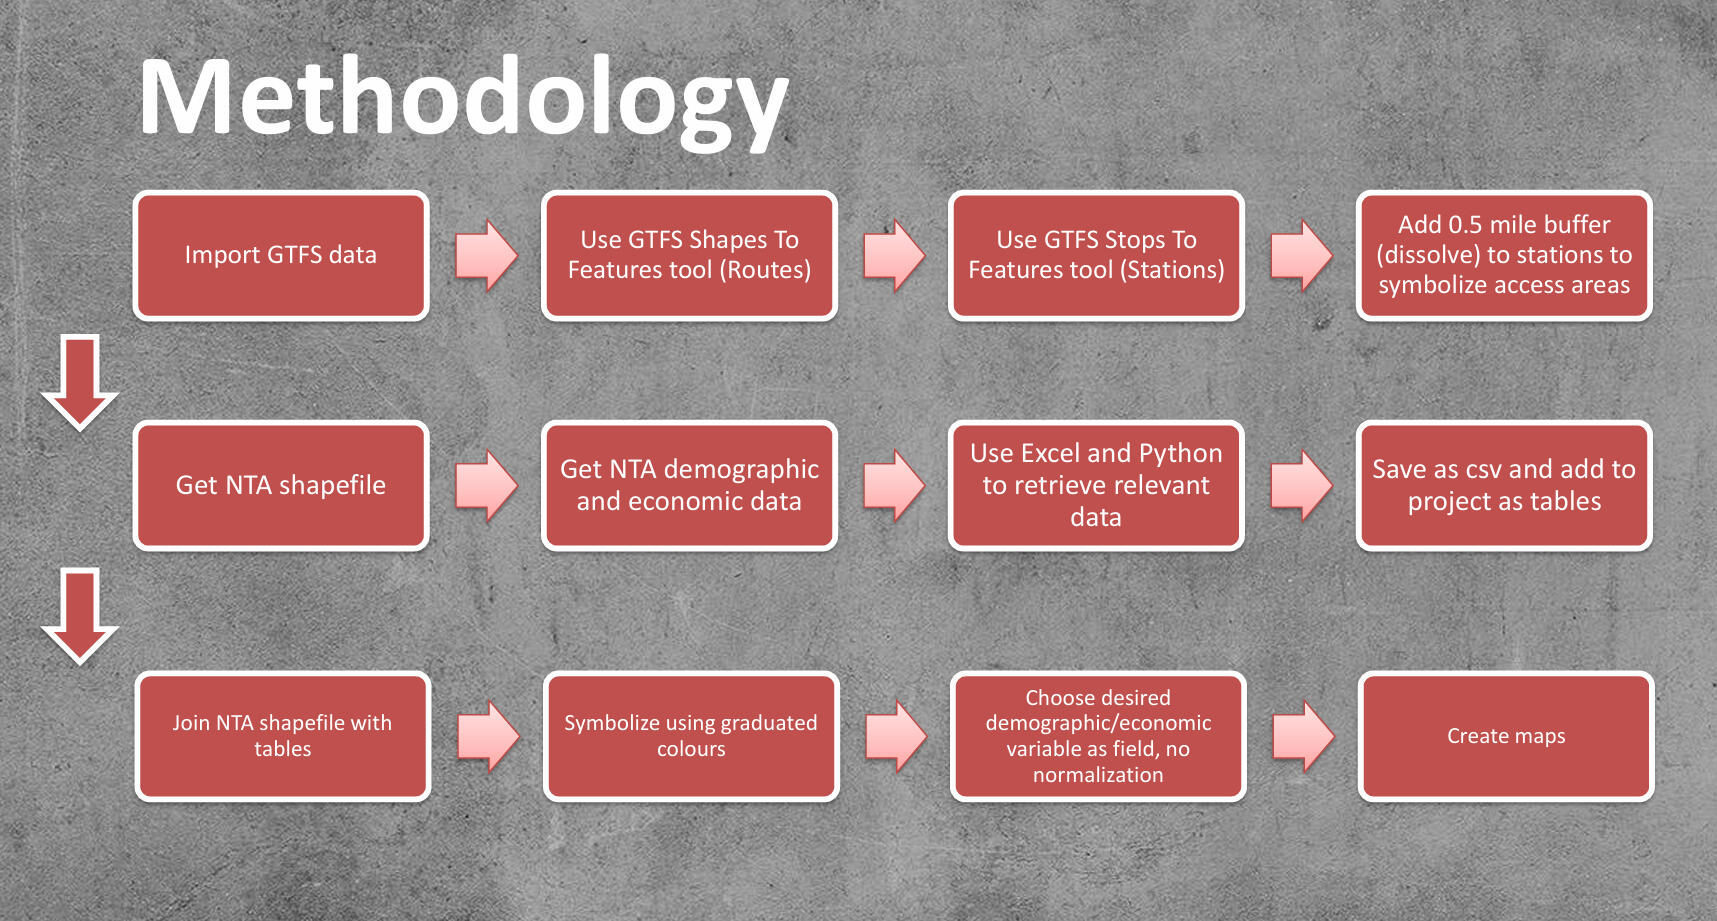
3) Exploring possible areas for improvement.My methodology was as follows:
Here were the key takeaways:
1) Transit Deserts Disproportionately Affect Majority-Black Neighbourhoods:
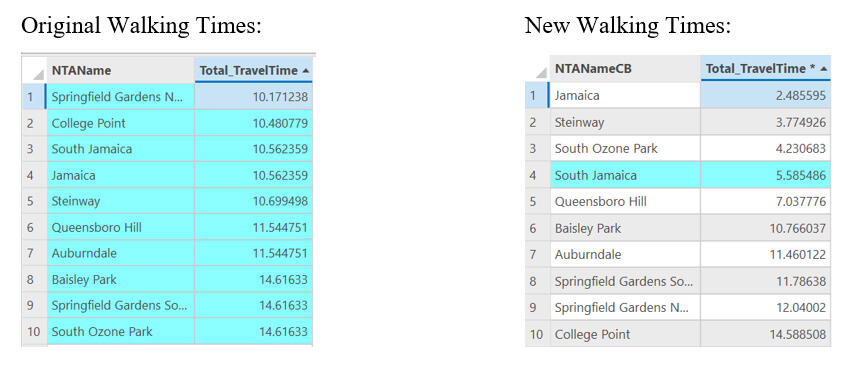
Four NTAs have a majority black population and greater than 10 minutes walking time to the closest subway, much higher than any other observed racial group.
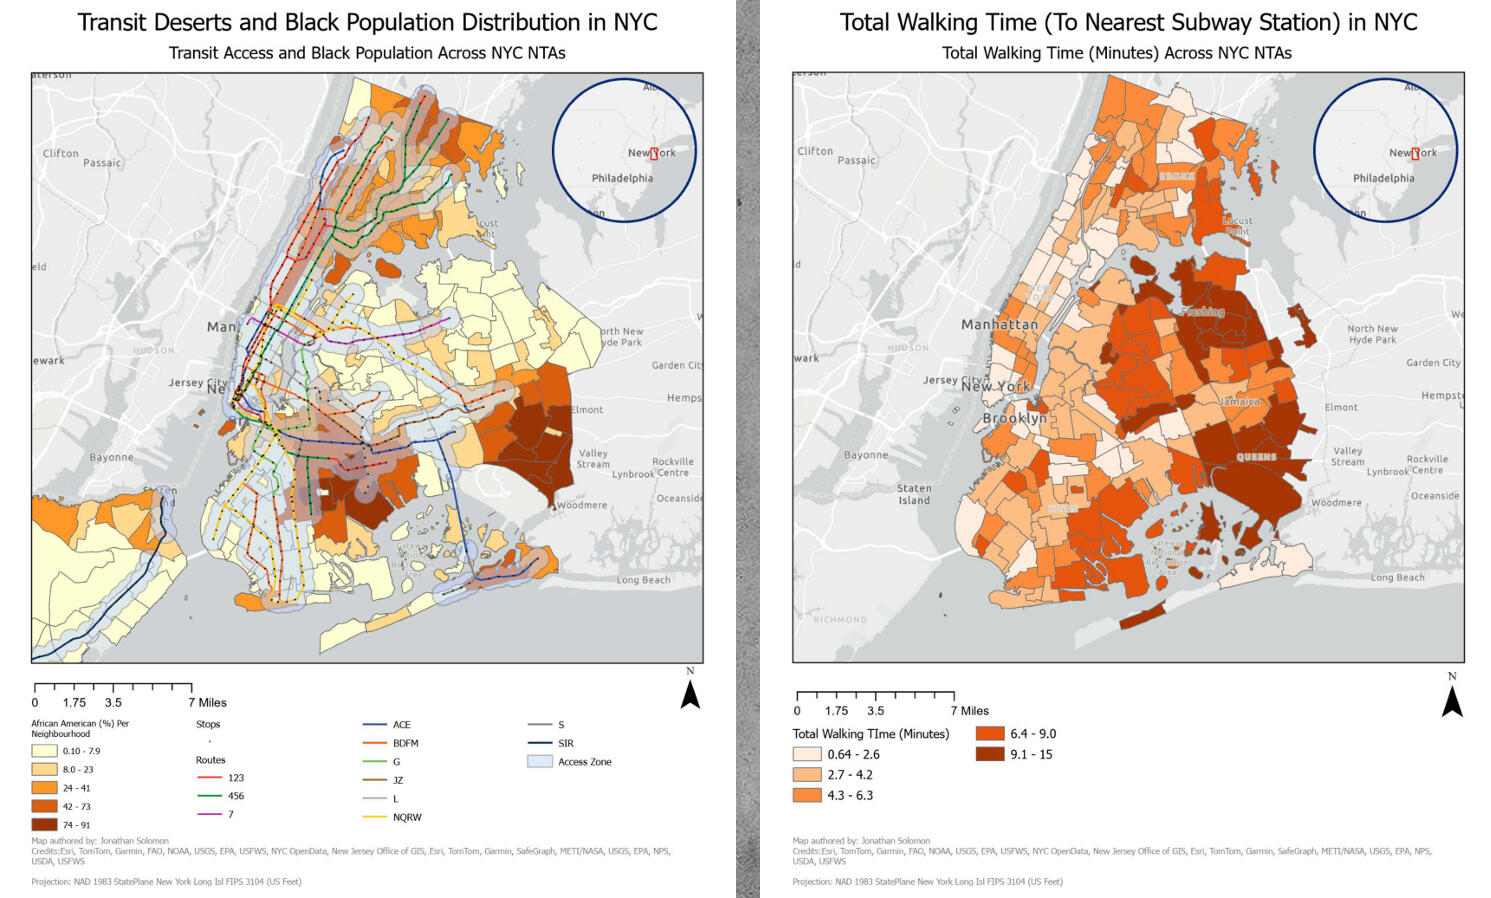
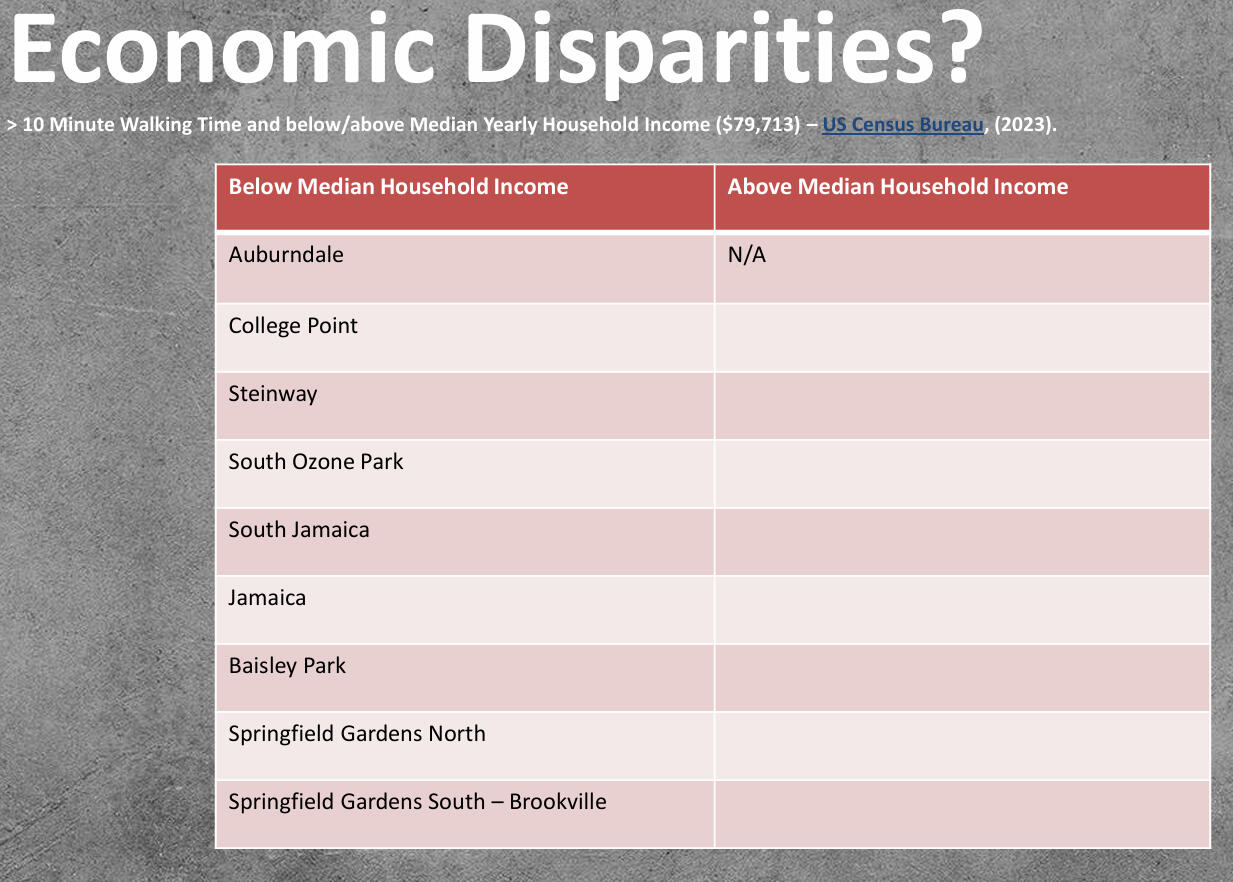
2) Lower-Income Neighbourhoods Are Significantly More Likely to Experience Poor Subway Access: With all 9 neighbourhoods with high (>10 min) walking times falling below the city’s median household income (compared to 0 higher-income neighbourhoods), one can conclude that there is a clear economic disparity in transit accessibility.
3) Negative Economic Feedback Loop:
"People need access to high-quality transportation in order to find and retain better jobs." (Jiao, 2018)
The results suggest a link between transit access, upward mobility and income inequality.
4) Adding hypothetical Citibike stations in high-traffic areas within low-income neighbourhoods significantly cut down walking time to the nearest train stations.
Mapping the road to reparations: Exploring Grassroots African American History in Massachusetts

This summer, I had the privilege of conducting research under the supervision of Dr. Power-Greene. This research consisted of leveraging existing datasets and analytical tools compiled by prior researchers and organizations to show the presence, movement, and stories of African Americans in Pioneer Valley and Massachusetts from the 1700s to the present.
I sought to address the following objectives:
1) Identify and map grassroots efforts across Massachusetts
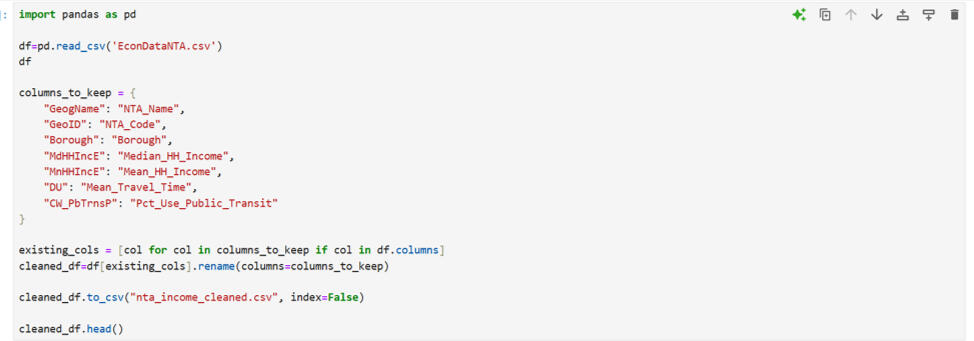
2) Collect and clean archival records documenting Black lives in Pioneer Valley
3) Conduct aggregate family tracing using the cleaned datasets
4) Apply GIS tools to visualize migration patterns and community formation.
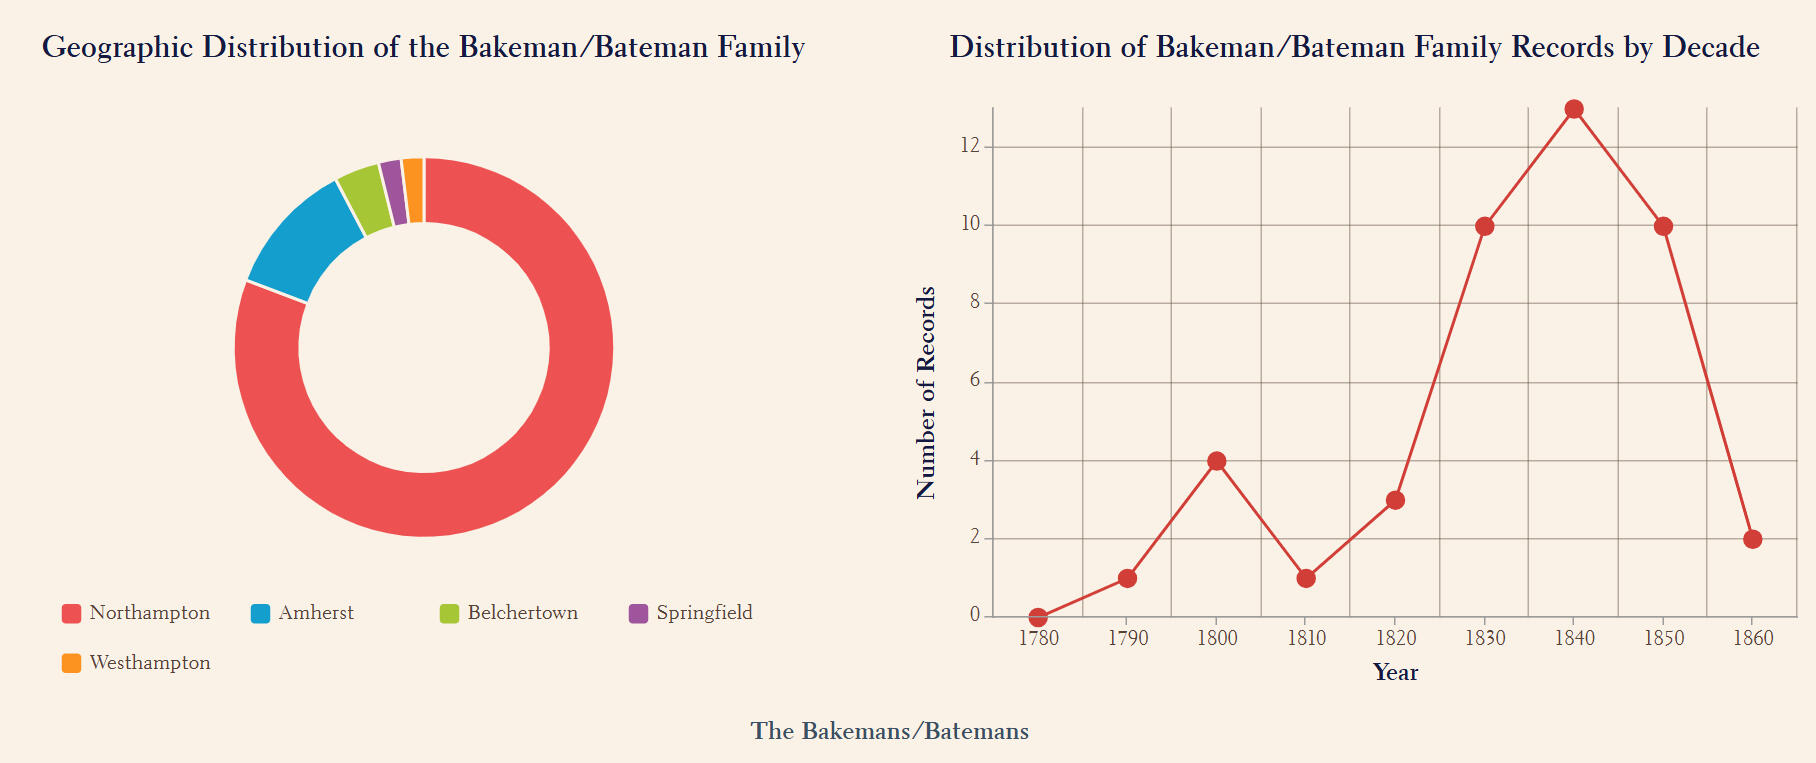
5) Complete a case study on the Bakeman/Bateman family’s multigenerational journey.The data for this research was gathered from Documenting the Early History of Black Lives in the Connecticut River Valley, a project that compiled its dataset through volunteer researchers working across ten Connecticut River Valley archival repositories. The raw dataset encompasses over 3000 records spanning from 1658 to 1890, including but not limited to information such as the individual’s name, source ID, freedom status, date/year of birth and marital status. After cleaning, over 1450 unique individual records remain.Key Findings:
1) Northampton (559) had the highest number of archival records, followed by Springfield (332) and Amherst (255).
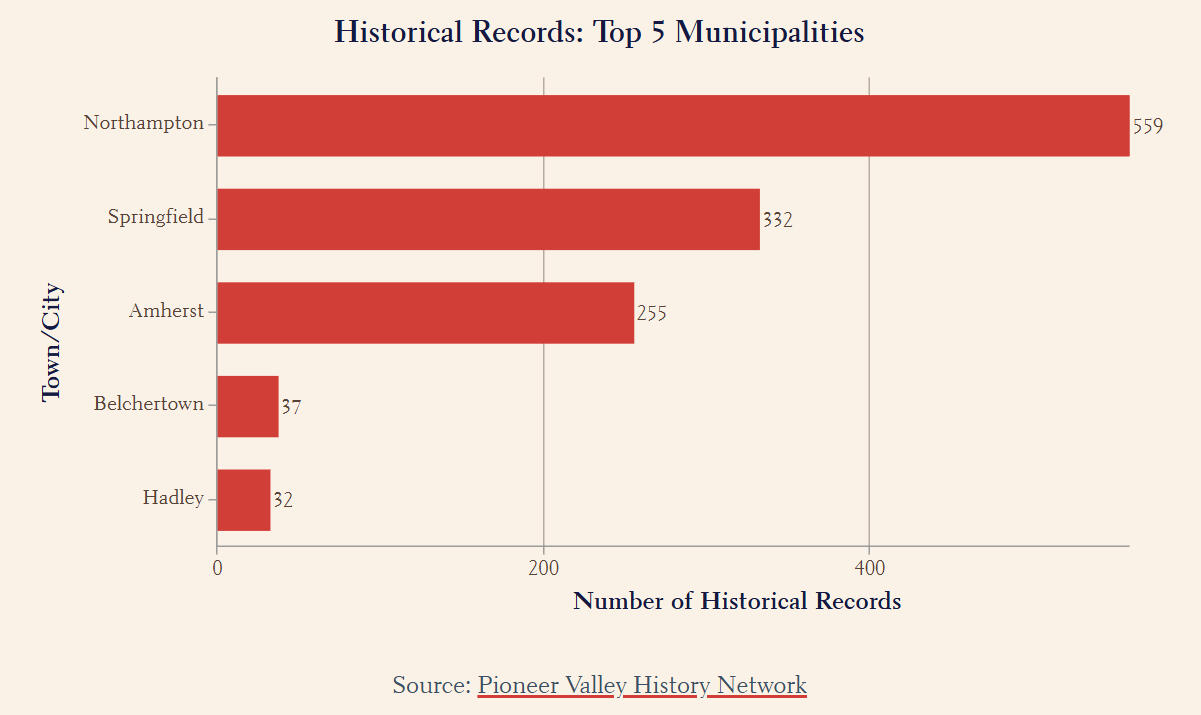
African American Movement from 1650 - 1900 Across Pioneer Valley
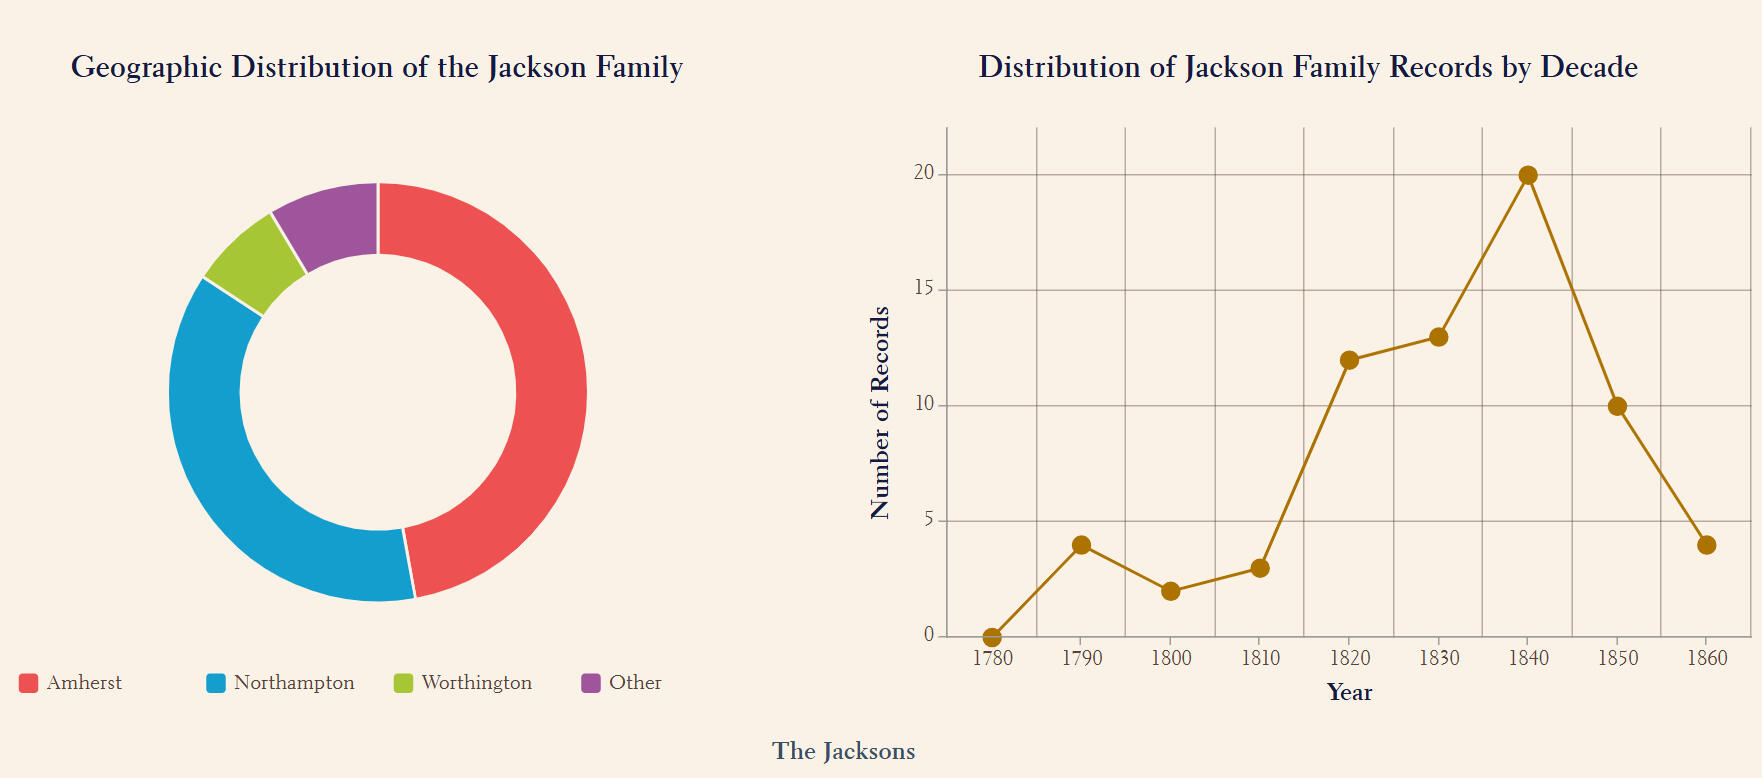
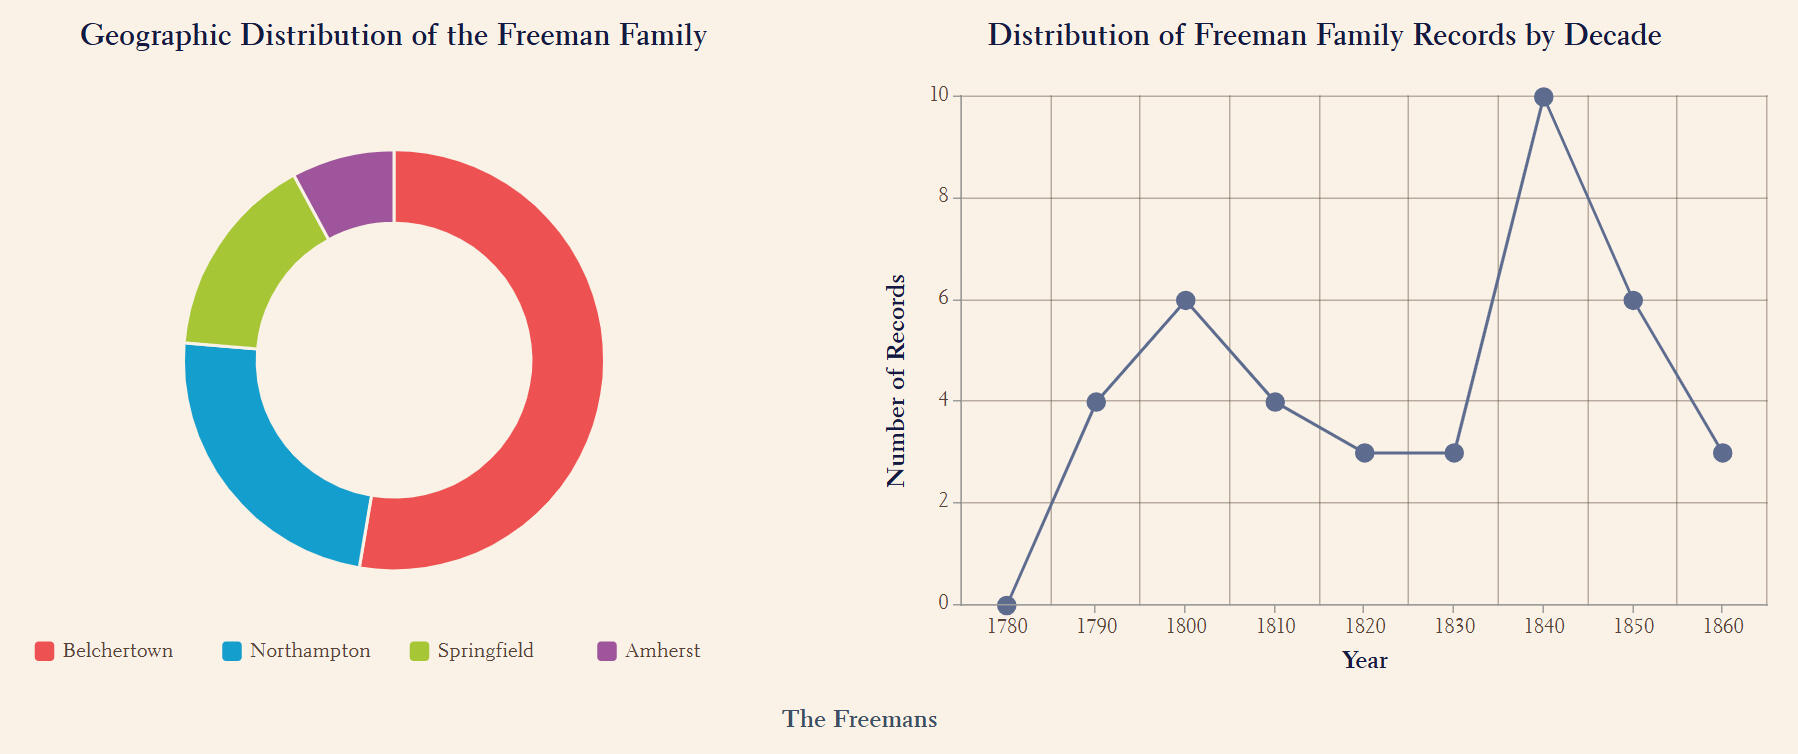
2) Certain prominent families were notably concentrated in specific neighborhoods, reflecting strong historical ties to those areas. For example, the Bakemans were prominent in Northampton, the Freemans in Belchertown, and the Jacksons in both Amherst and Northampton.
Explore the full interactive StoryMap and case study here!